
See where data centers are going.
Map U.S. data centers, compare sites and utilities, and follow projects through development.
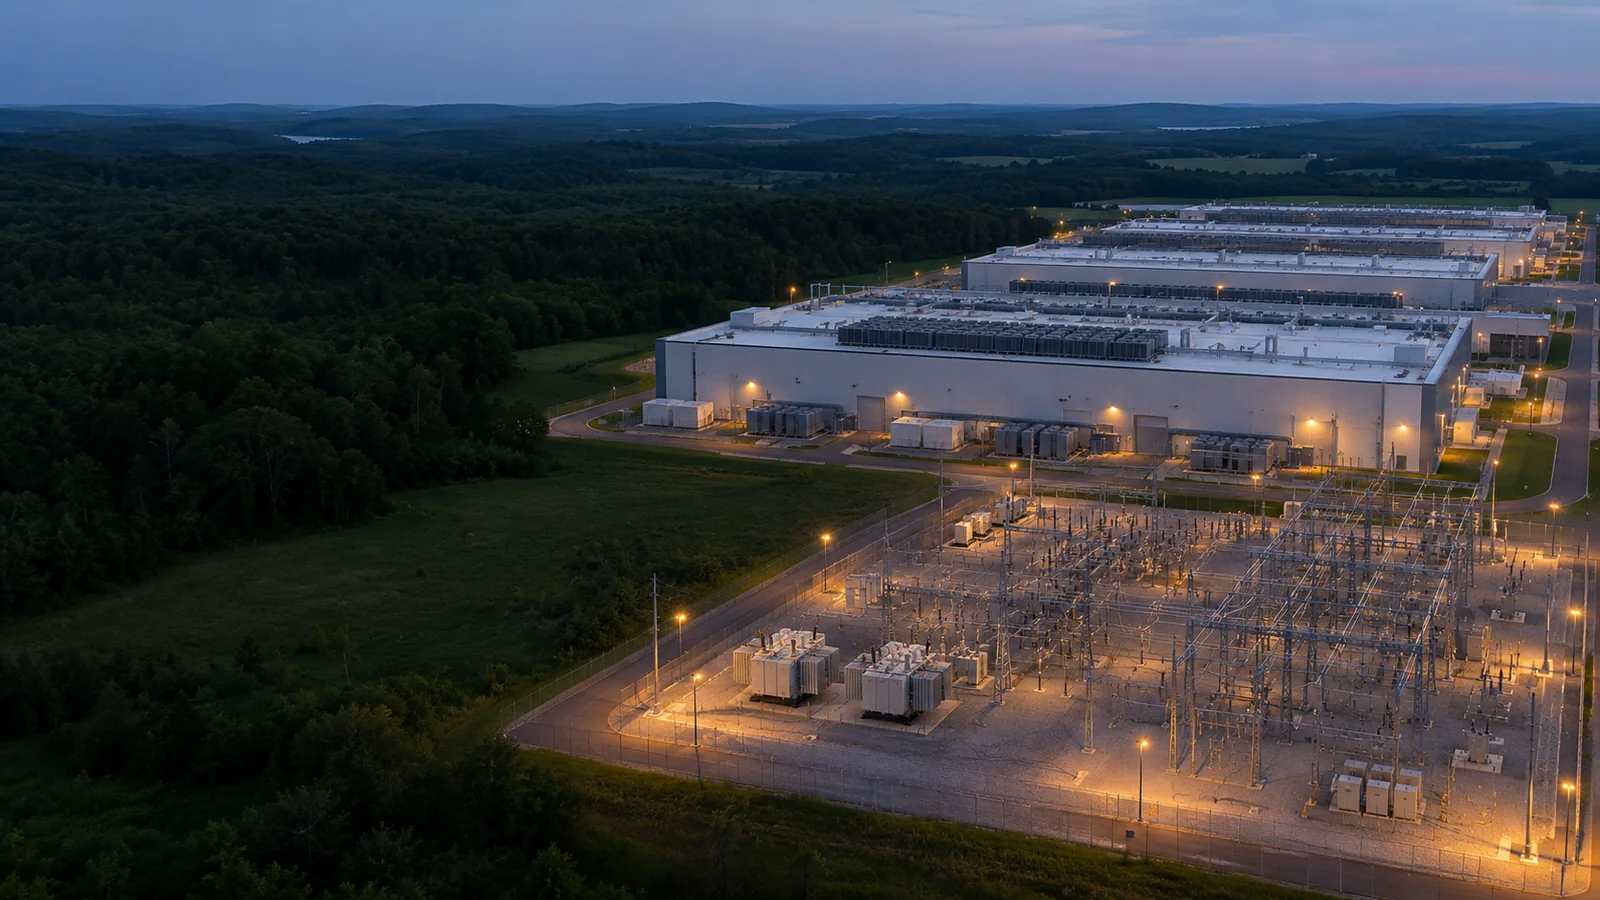
Start with the campus and surrounding market in Facility Atlas.
Start with a market.
Follow the evidence.
Choose a sample market, assemble the evidence for a report, and follow a development from announcement to scheduled activation.
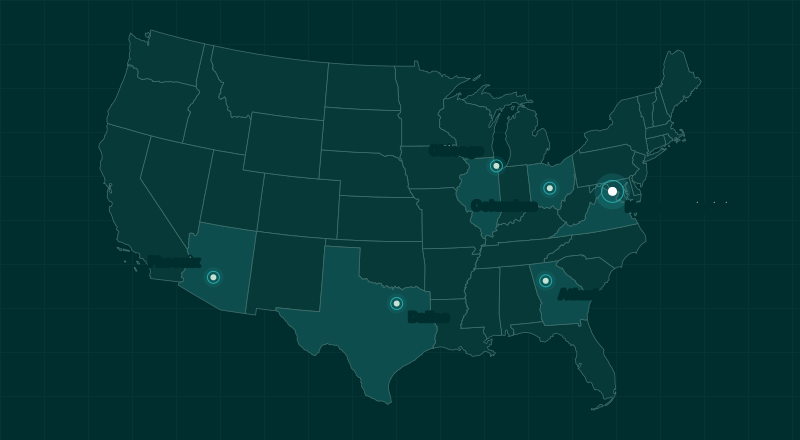
Facility Atlas
Filter U.S. facilities by geography and lifecycle stage, then drill into a site or explore an operator’s portfolio.
Narrow a market to a county, then review facilities and their operators.
- Facility inventory
- Utility context
- County context
- Facilities in the market
- Reported utility context
- County and market context
Intelligence Reports
Assess a location or a wider market using facility inventory, utility context, and other available evidence. Save reports for later review.
-
Project announcedAnnouncement
-
Construction beginsConstruction milestone
-
Activation expectedScheduled milestone
Market Pulse
Follow reported project milestones, construction activity, and scheduled activations across the markets you research.
- Milestones
- Reported project activity
- Construction
- Projects underway
- Outlook
- Scheduled activations
Build a shortlist
worth investigating.
From your first market scan to your next project update, follow the evidence back to the site.
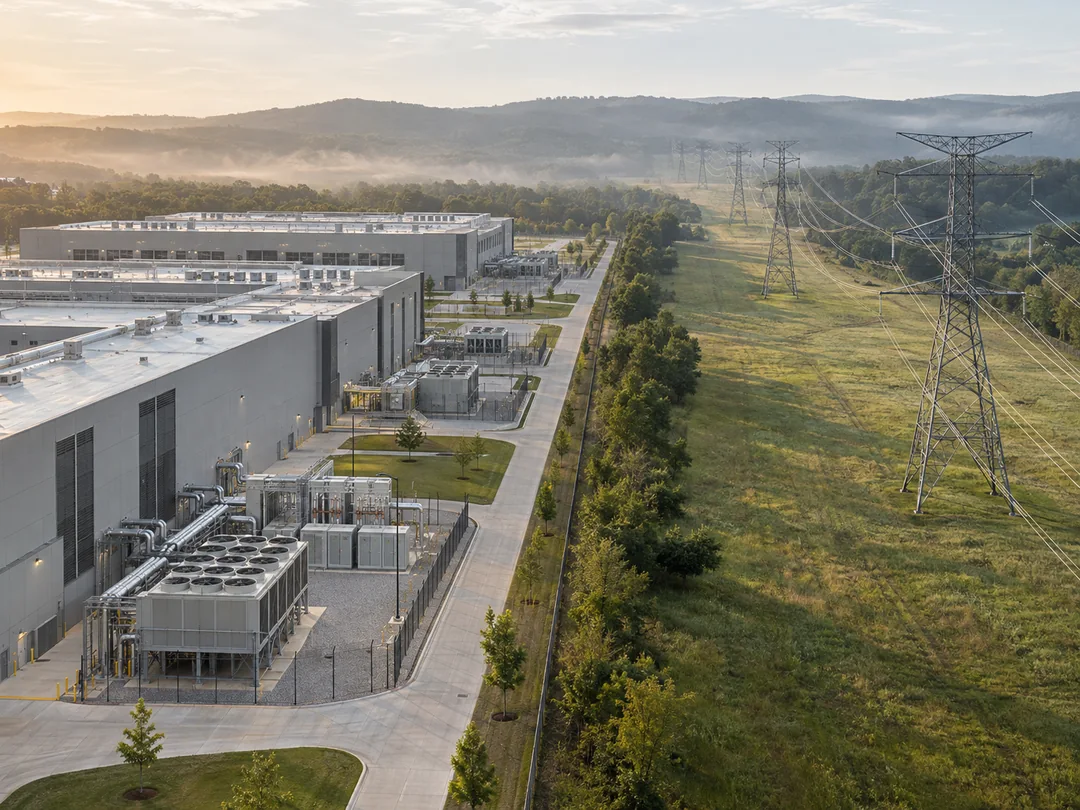
-
Find facilities
Start with a state, county, or market and narrow the list by development stage.
Explore Facility Atlas -
Assess the evidence
Review facility records, utility service territories, and saved site and market reports.
Explore Intelligence Reports -
Follow project milestones
Revisit your markets as announcements, construction milestones, and schedules surface.
Explore Market Pulse
Common questions
Who is Volterra IQ for?
Volterra IQ is built for teams that research U.S. data centers and evaluate markets or locations, including site selection, development, and market intelligence teams.
What does the utility information cover?
Utility profiles bring together reported service territories and annual power context. Confirm site-specific capacity and interconnection timelines with the serving utility.
How do I get into the app?
Volterra IQ is currently invitation-only. If your team sent you an invitation, follow that link to join your workspace. If you’ve already joined, sign in to the app.
Bring your next market into focus.
Open Volterra IQ to explore the facilities, operators, and utilities behind it.